Jupyter/ipywidget/plotly code to automate the production and exploration of GHG emissions and GDP data by country
Environmental Kuznetz curve analysis
 Environmental Kuznetz curve analysis
Jupyter/ipywidget/plotly code to automate the production and exploration of GHG emissions and GDP data by country
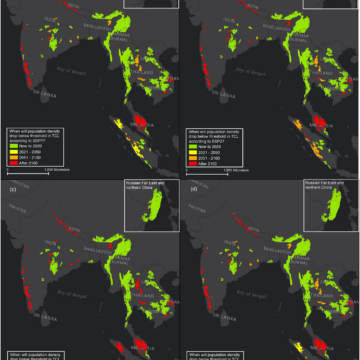 Shared Socioeconomic Pathways tiger analysis
Analysis of effects of SSP-modeled population changes on tiger habitat
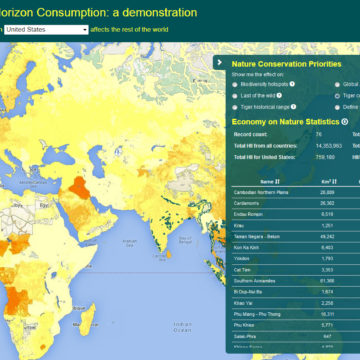 Over-the-horizon consumption
Web application allowing user to see a map of the impact of the consumption in one country on the rest of the world
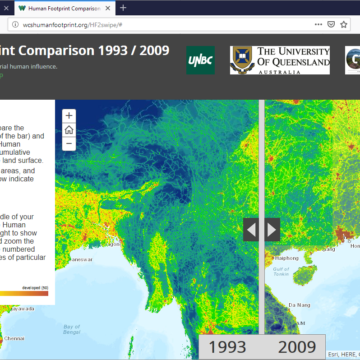 Human Footprint 2 website and atlas
Website produced very rapidly showcasing WCS/UQ reanalysis of global human footprint
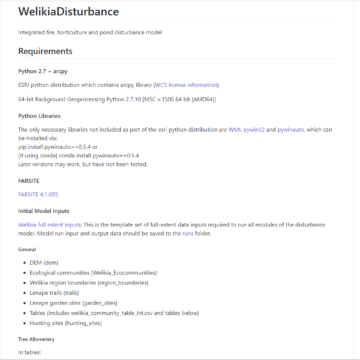 Disturbance modeling
Scripts for modeling the effects of fire, horticulture, and beaver ponds on 1609 NYC landscape over prior 200 years
 Muir Web
Database graph-based network analysis that predicts species and atrophic element distributions
 Visionmaker NYC
Web application for developing ecologically sustainable visions of New York City via “ecosystem painting” tools